Data Explorer
Explore and analyze your dataset.
Find patterns within and between variables.
Use industry standard statistical techniques without being a stats expert.
Get plain english explanation.
Data explorer makes the world of data analysis accessible to the rest of us.
Languages: English, Chinese
Device: iPad, iPhone, iPod touch

Learn more about Data Explorer
Input
Browse
Variables
Analysis
Output
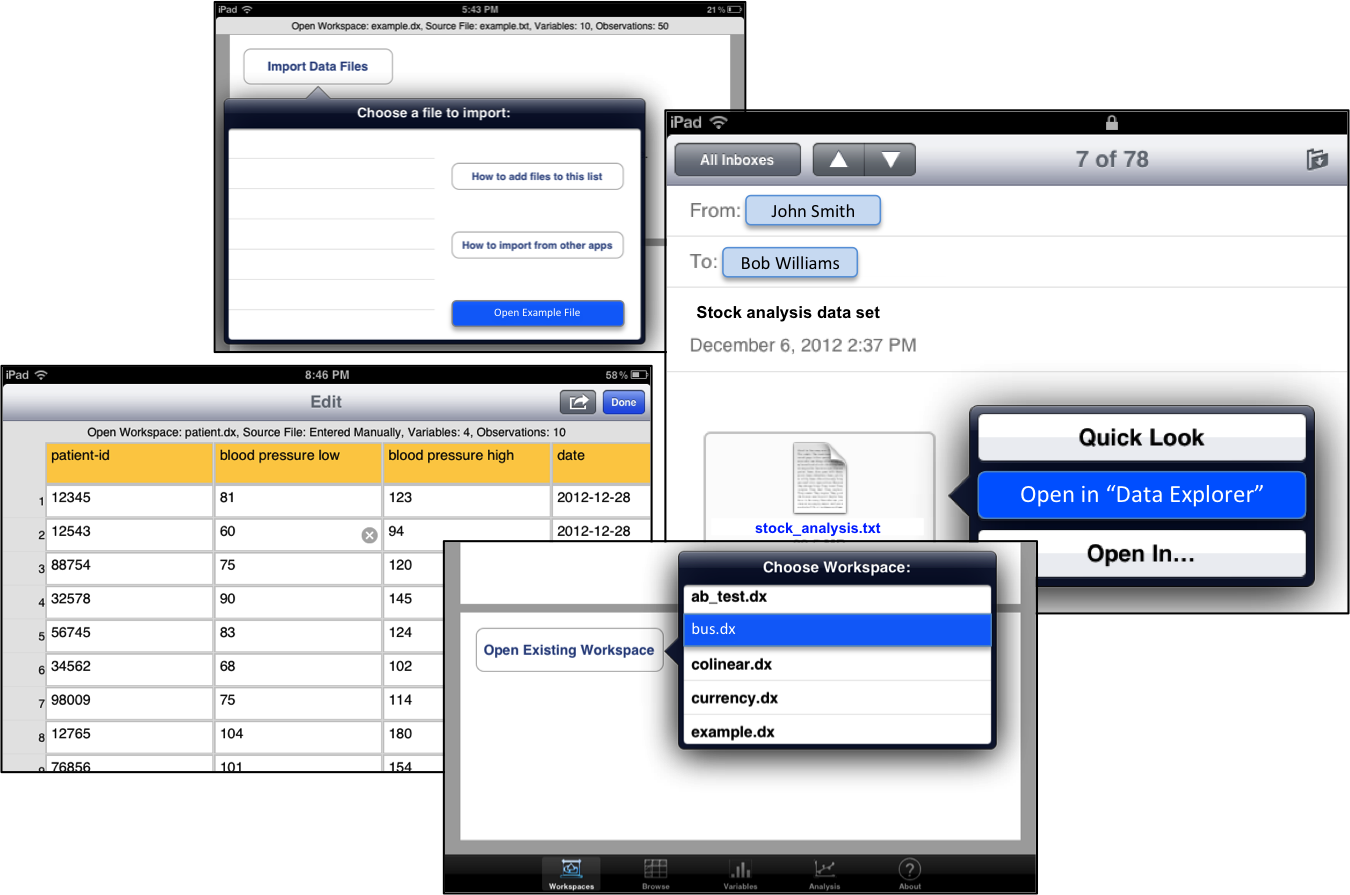
Data Input
Data Explorer accepts data input in a number of ways:
- Send data files to Data Explorer via the "Open In..." menu in other common apps like Mail, Safari, Dropbox, and Numbers
- The following file formats are supported:
- Excel files (.xlsx and .xls -- Numbers can export in .xls format)
- Comma separated values (.csv)
- Delimited text files (.txt)
- Files can be imported with or without a header row
- For text files you can choose your delimiter from: comma, tab, and space
- For excel files you can choose which sheet you want to import
- Enter data by hand directly within the app (useful for users in the field)
- Upload data files via iTunes on your computer
- An example file is provided so you can start playing around even if you don't have a data set handy
- Current version limited to 100,000 rows and 500 columns to be conservative about performance
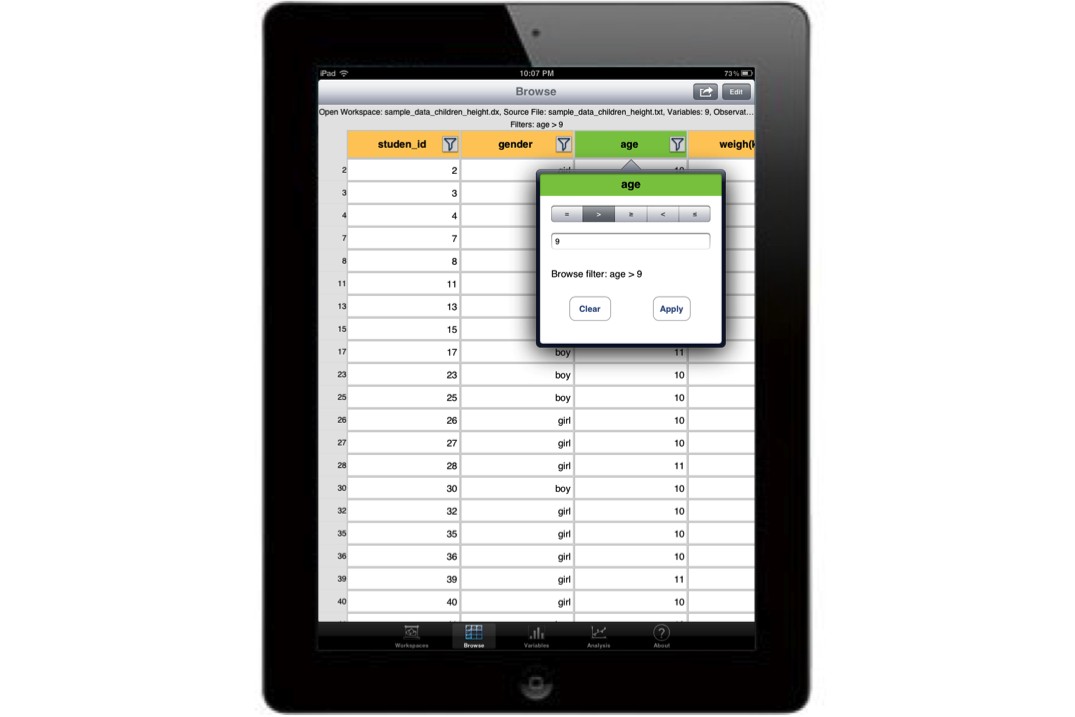
Browse and Edit Data with Filters
Sometimes to answer your questions you need to look at your data directly.
Browse View lets you easily scroll through your raw dataset in table form. Use filters to focus in on just the rows you care about.
You can edit your data in place, correcting data quality issues on the spot.
You can also add additional rows and columns and enter data into them if you are collecting results in the field.
Full data export to CSV is available so your dataset won't ever be locked in.
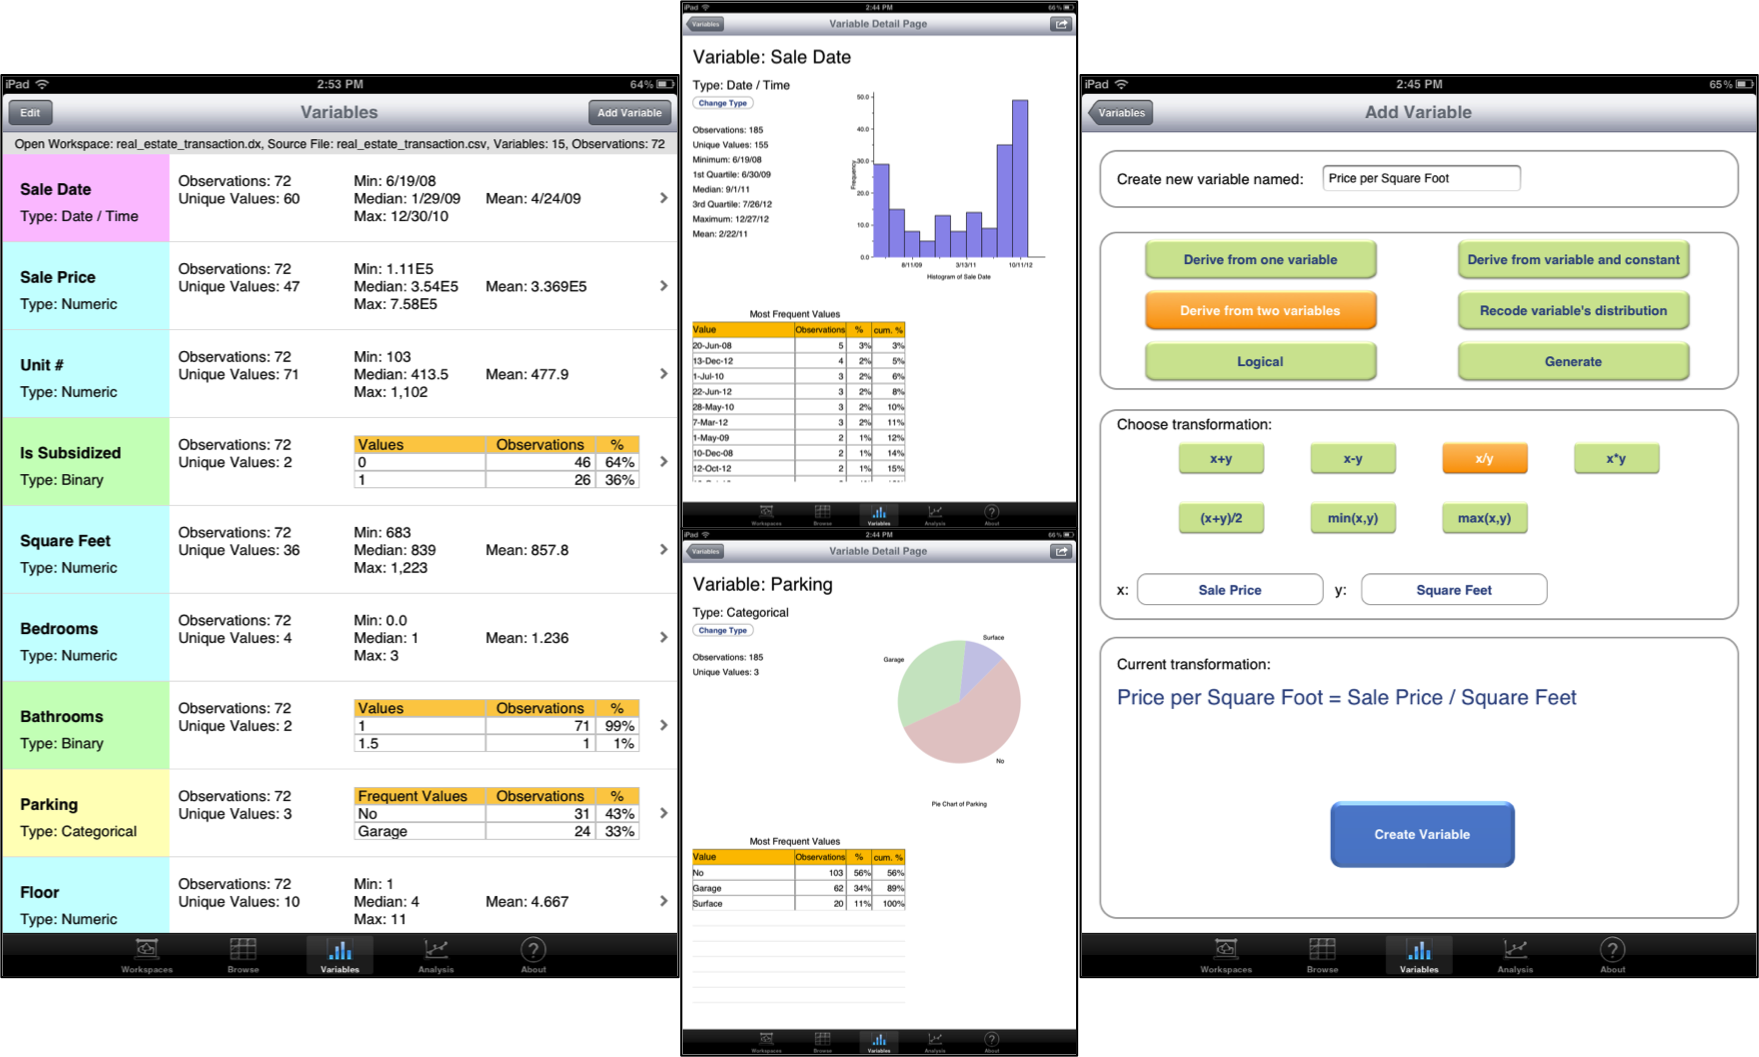
Understand Variables
Data Explorer supports the following types of data:
- numerical
- dates / times
- categorical
- binary (categorical with two categories)
Variables are automatically assigned a type on import based on their contents. You can set the type of each variable later at any time.
Use the Variables overview page to get a quick glance at all your variables, along with some basic statistics on each (mean, min, max, etc). Then focus in on any variable and see a plot of its distribution as well as more detailed statistics and a table of its most frequent values.
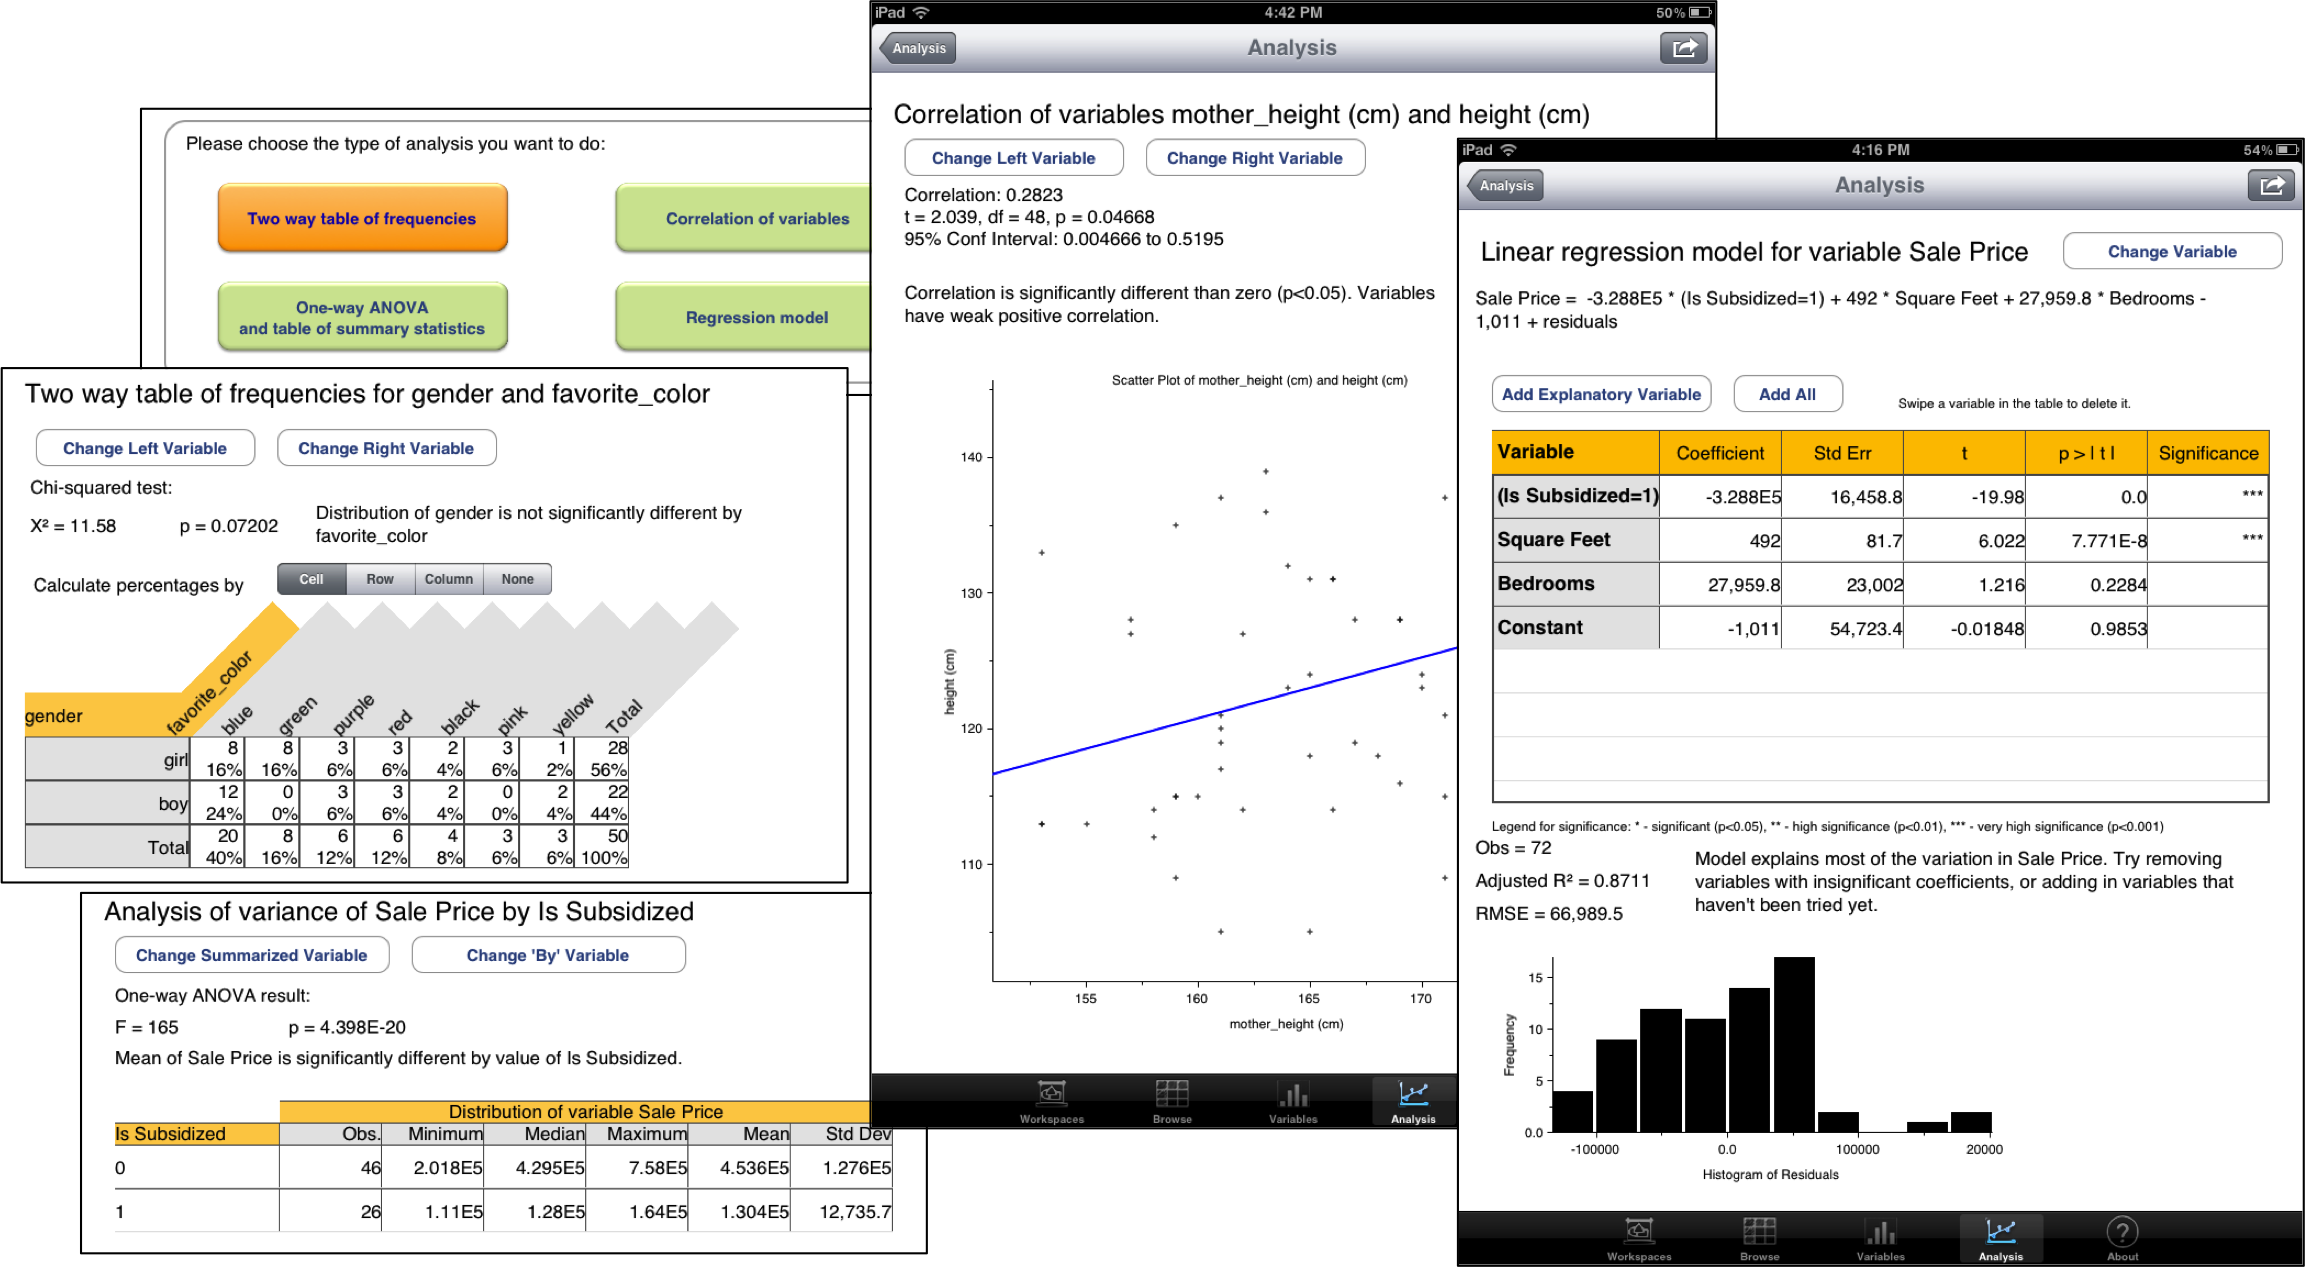
Data Analysis
The real magic of data analysis comes in how your variables relate to each other. Data Explorer gives you a number of tools to discover these:
- Two-way tables let you look at how two categorical variables interact (includes chi-square test to see if differences in distribution are significant)
- See the distribution of a numerical variable or date variable broken down by levels of a categorical variable, including one-way ANOVA
- See how two numerical variables vary with each other (correlation)
- Explain how one numerical variable varies by a combination of other numerical variables (linear and logistic regression)
Analyses give results in statistical terms and also in plain english. The interface makse it easy to try many variable combinations with just a few taps.
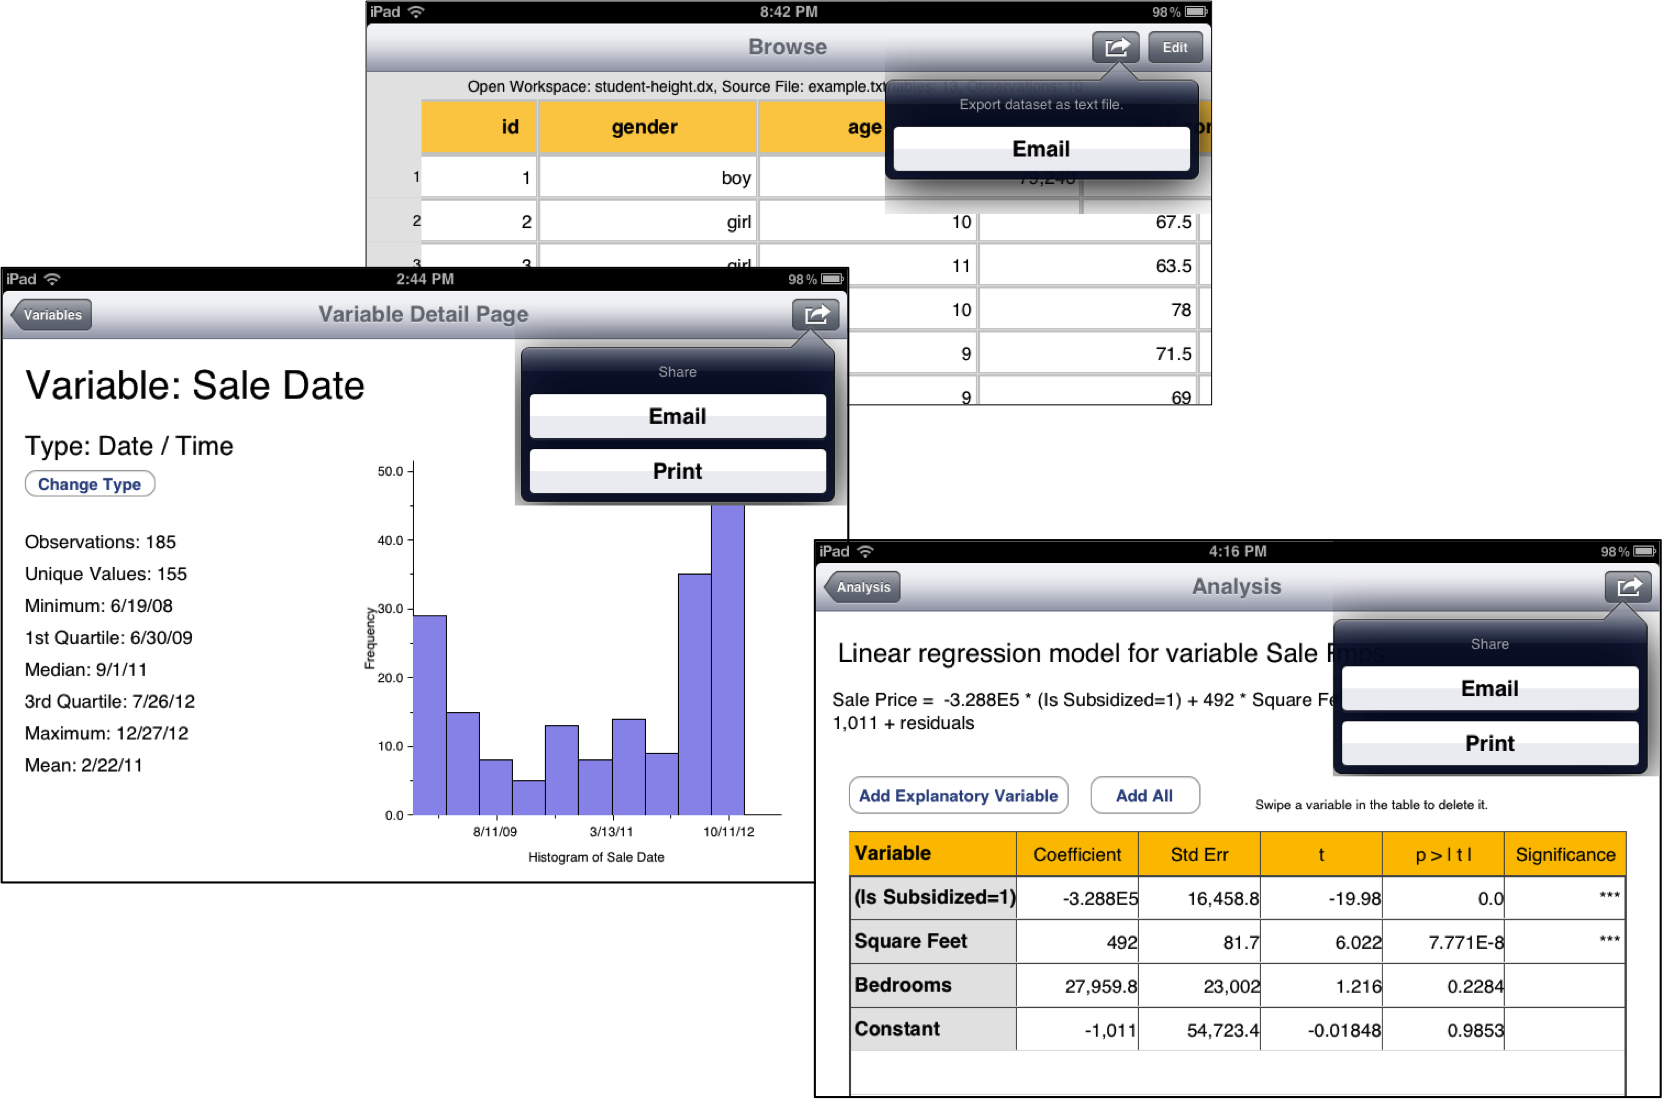
Output Results
Share your results easily.
- Email your results as PDF reports and CSV files that are easy to open in other programs
- Print results directly from your device
- Email your dataset as a CSV file and continue your analysis with other tools